
I've been digging into the WMF's Differential Privacy pageviews dataset. Results so far: people tend to read Wikipedia articles related to the global region they’re located in, and the proportions of pageviews about broad topic areas (science, history, etc.) vary relatively little across regions.
Andrew Russell Green, 2026-01-13
[2026-01-16: Minor updates]
[2026-01-18: I’m working on a new framing and presentation of this work, with more context. I’ll also add terminology to avoid confusion about the proportion estimates being weighted averages, and will calculate results without the weights, too, for comparison. Please stay tuned, and thanks so much, everyone, for the feedback and support!]
[2026-01-22: A draft overview of the motivations and context for this work is on MetaWiki.]
First of all, welcome to the very first post of this blog!
It’s my pleasure to share the preliminary results of research I’ve been working on for the past few months. The topic is: patterns in how people read Wikipedia, across countries, regions and languages. The most interesting result so far is that readers across the globe demonstrate significant regional self-focus.
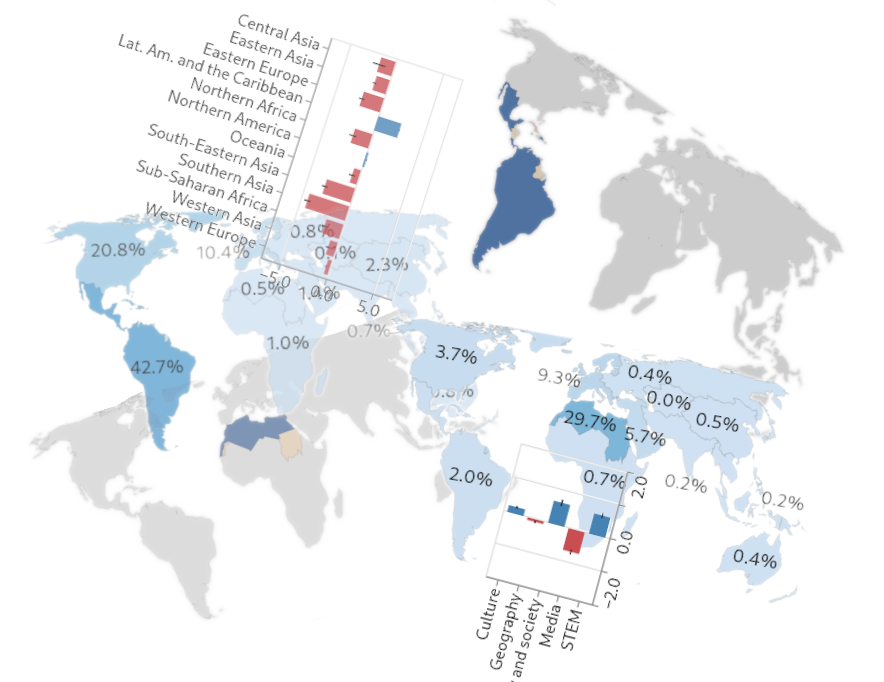
Read on for details, or, if you just want to see a single, giant image with all the plots, click here.
Please don’t hesitate to send any feedback you may have! A paper on this project is forthcoming.
A lot of fantastic research has been conducted about Wikipedia readership (see this recent overview [1]) however, I’m not aware of other work in precisely these terms. Please let me know if I’ve missed anything!
Research questions
The two research questions I’ve been working with are:
RQ1: What patterns exist in Wikipedia pageviews, related to the topics and geographic locations associated with the articles viewed, across readers’ own geographic locations and Wikipedia language editions?
RQ2: What hypotheses can be put forward about such patterns, from causal and systems perspectives on sociocultural phenomena?
In RQ1, associated with the articles means, “that the articles are about, or that are closely related to the topic of the articles”. For example, an article about a scientist born in country A would be associated with both science and country A (more on this below).
For brevity, this is the phrase I’ll use. When I say that a pageview was associated with a location or topic, I mean that the pageview was of an article whose subject is associated with that location or topic.
Data sources
The most detailed public source for Wikipedia pageview data is the Wikimedia Foundation’s Differential Privacy Pageviews dataset [2], which contains daily, per-country pageview counts for nearly all articles, across all Wikipedia language editions (plus other Wikimedia wikis, like Wiktionary). The data comes from the logs of Wikimedia Foundation (WMF) servers.
To protect reader privacy, the WMF adds noise and removes information about some articles and countries. Even so, the dataset offers a usable reflection of reader activity for most countries.
This is the primary dataset for this project. However, it doesn’t say what the articles people read are about. It just has each article’s title and database ID, the Wikipedia language edition it’s in, the country it was viewed from, and the Wikidata QID (see below for what this is and how I used it) [3].
To determine articles’ topics and the geographic locations associated with them, I used two machine-learning models [4][5]. The WMF created these models and provides access to them over API endpoints.
Since it wasn’t possible to fetch the models’ predictions for all articles viewed over any reasonable timespan (the Differential Privacy dataset is huge), I sampled pageviews and queried the models about articles that appear in the samples.
Initial results
Based on per-country samples of pageviews from October 2025, we see the following trends, across all world regions, for the combined pageviews of all Wikipedia language editions:
1) Readers consistently access articles associated with the region they are located in at a higher rate than readers in other regions.
2) Conversely, there is relatively less variation in the proportions of broad topic areas (e.g., media, science, geography, etc.) associated with pageviews, across regions.
Though preliminary, these results already seem quite robust!
The implications are significant. Previous research has shown that Wikipedias can have a geographical bias: English Wikipedia has more articles about wealthier regions than it has about other parts of the world [6]. Result (1) suggests that such biases don’t prevent readers from consulting Wikipedia about topics associated with their own regions. Consequently, the Wikimedia movement’s goal of working to address content biases seems eminently reasonable, since it involves expanding the type of content that readers demonstrably access [7].
Result (2) provides a contrast: despite the variation across pageviews from global regions seen in Result (1), readers access Wikipedia for broadly similar categories of information, at relatively similar rates, across regions and cultures. It may be a stretch to conclude much from this without further investigation, but potentially it could imply that the contexts and motivations for accessing Wikipedia, as well as the frequencies of their occurrence, are globally somewhat consistent.
An alternate hypothesis, perhaps more compatible with previous research [8], would be that for topics, the regional groupings used here are masking more significant differences among countries within regions.
It looks like there’s another pattern, but I haven't dug into it systematically yet. It may turn out to be equally robust. It is: (3) when comparing pageviews across languages within a given country or region, we see a lot of variation in the proportions of pageviews associated with each general topic area.
A possible explanation for this pattern is that people often prefer reading Wikipedia in a given language whenever the content they’re interested in is available in that language, and when it isn’t, they “fall back” to a different language edition (and either read Wikipedia directly in the fallback language, or consume the content using automatic translation).
If it holds, result (3) would show that the movement’s foundational goal of providing knowledge in readers’ own languages is amply justified by readership patterns.
Aaaaand without further ado, let’s dig into the charts!
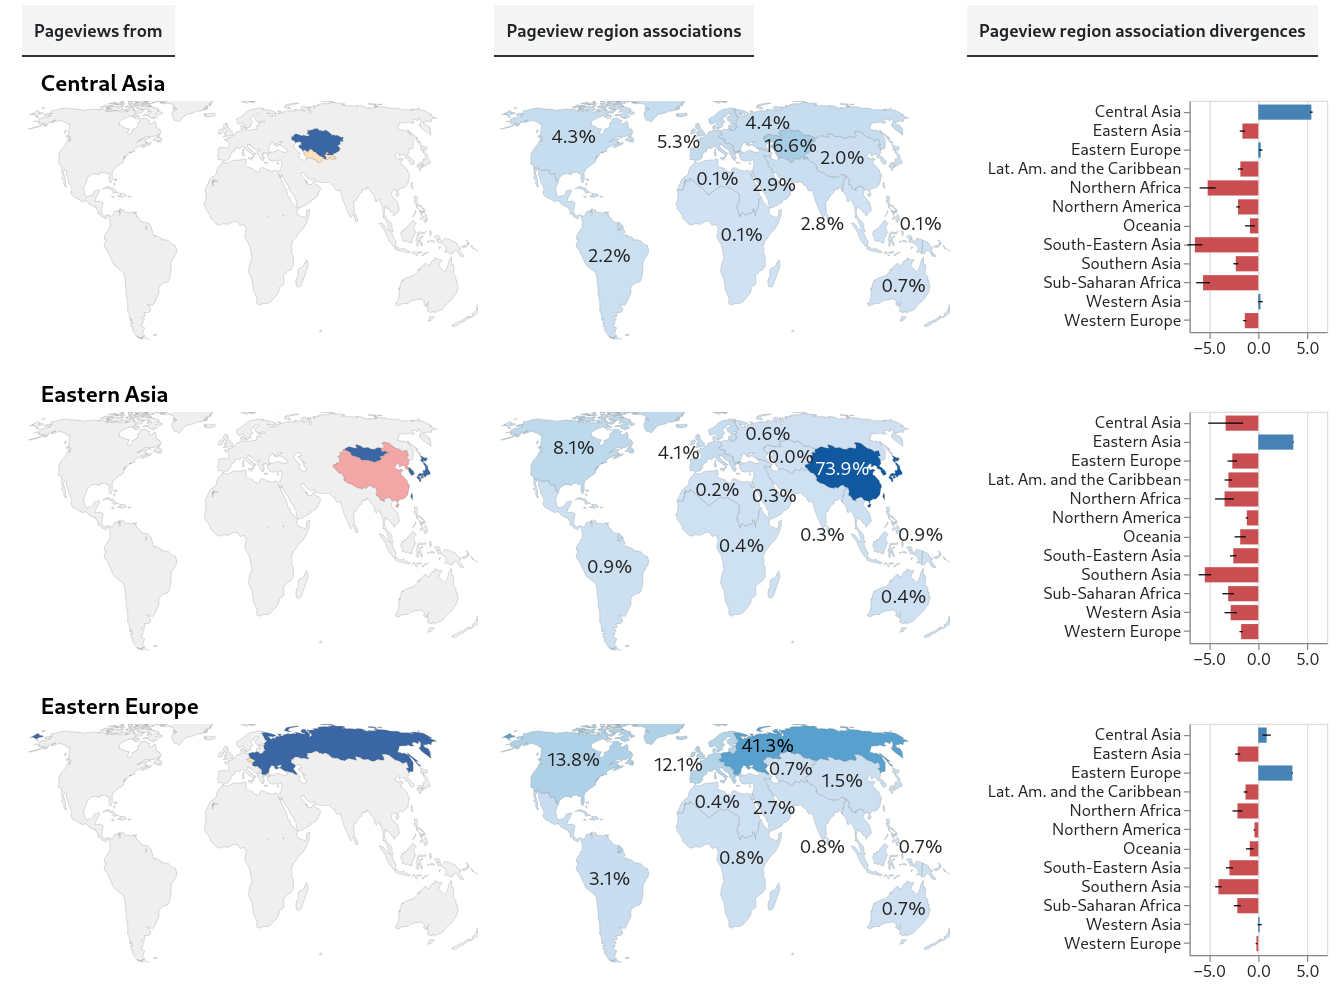
Pageview region associations
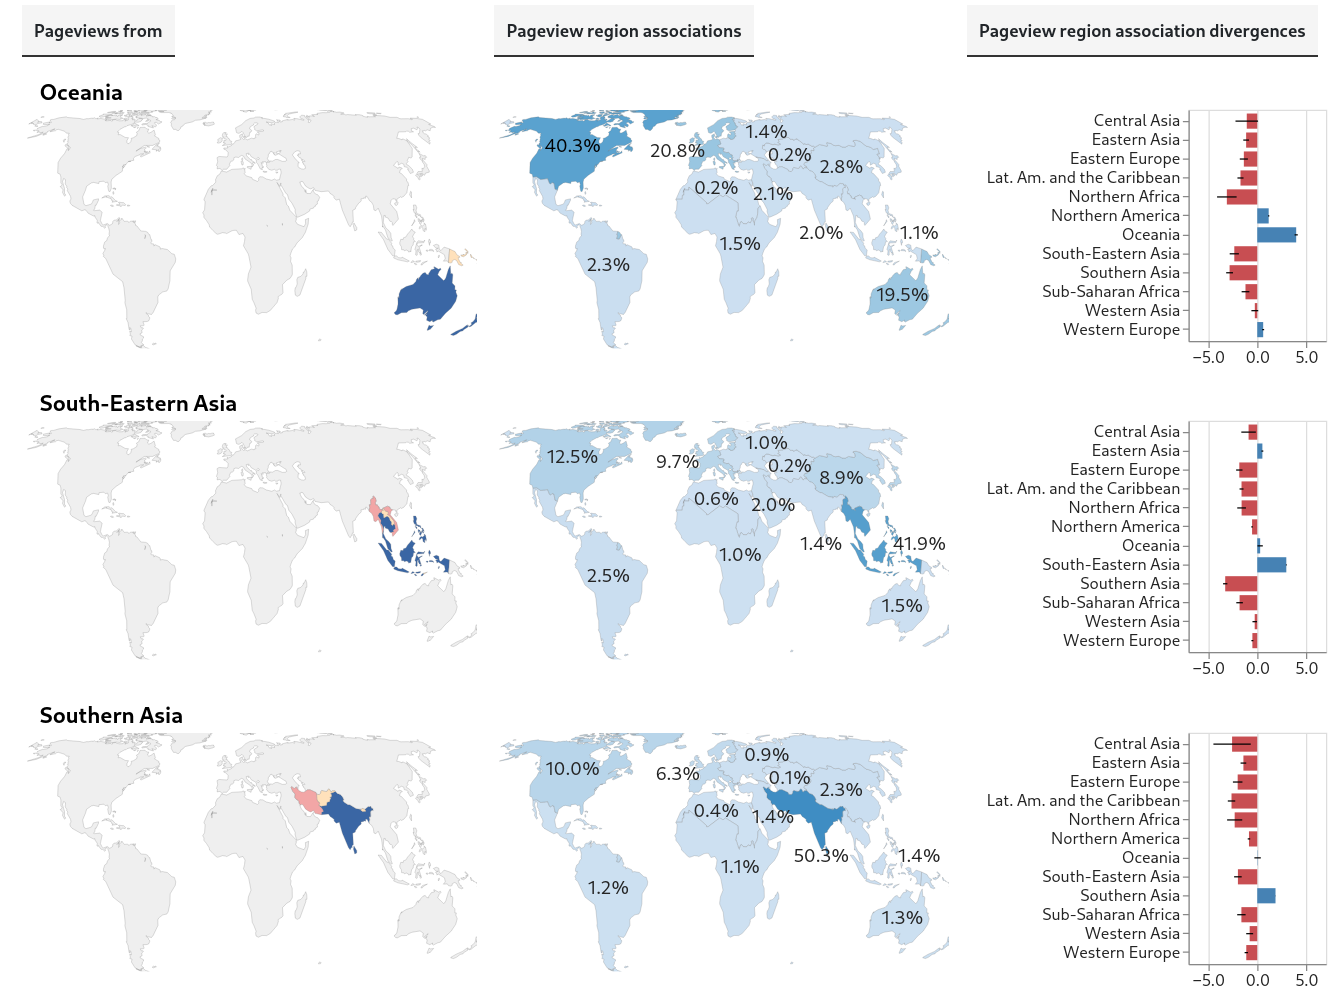
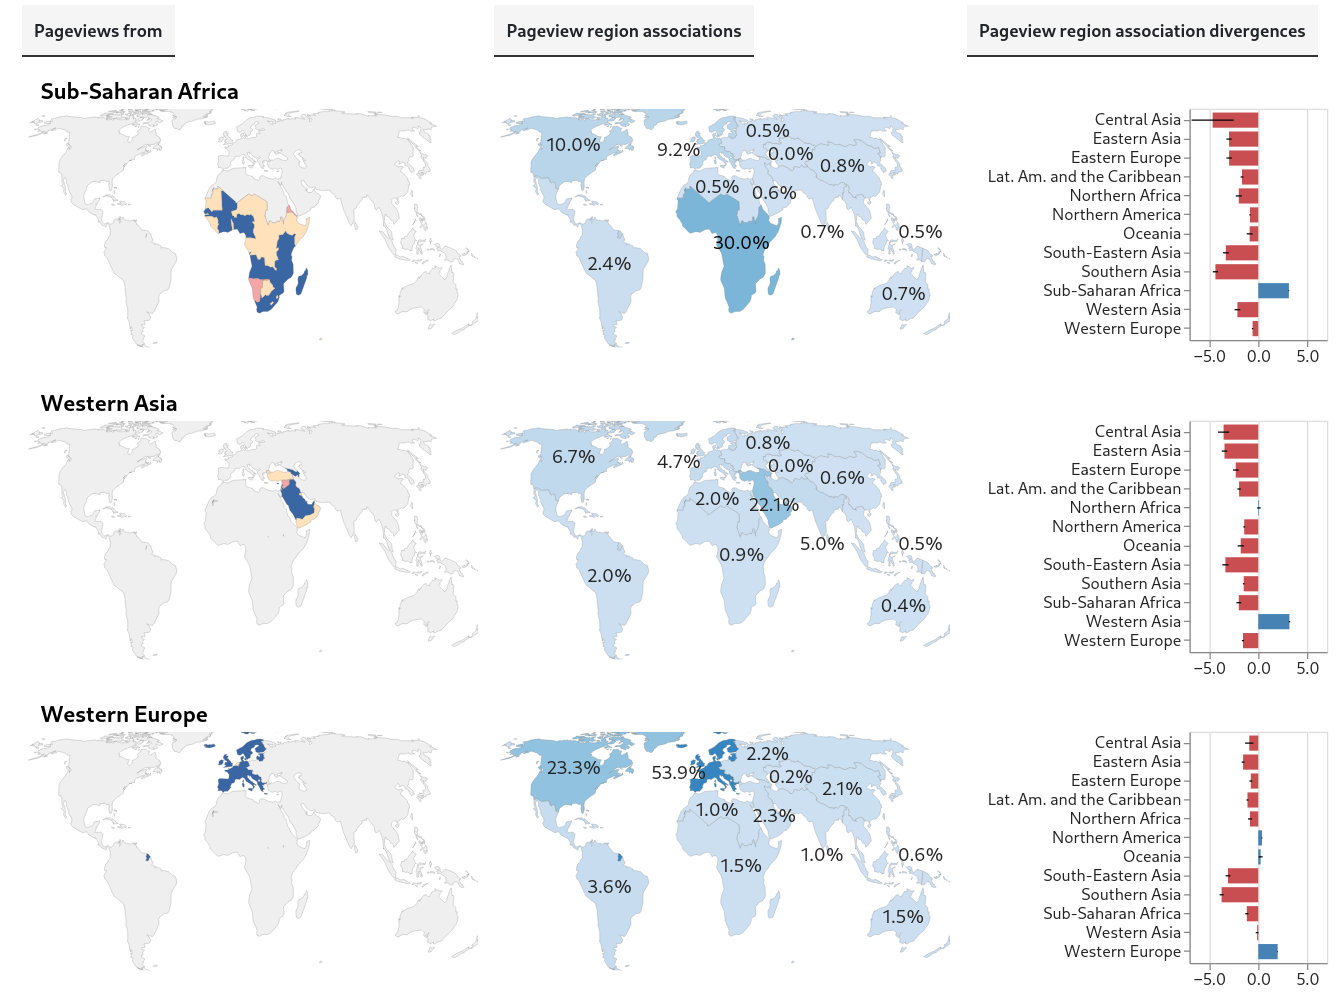
These charts show the first of the initial results described above. Each group of three charts (two maps and a bar chart) is about pageviews from a different global region.
(For region definitions, I’ve used a modified version of the United Nations Level 2 scheme [9]. This is a preliminary choice for exploratory purposes.)
Since we have 12 regions, for ease of viewing, I’ve created 4 images with plots for 3 regions each:
Central Asia, Eastern Asia, Eastern Europe
Lat. Am. and the Caribbean, Northern Africa, Northern America
Oceania, South-Eastern Asia, Southern Asia
Sub-Saharan Africa, Western Asia, Western Europe
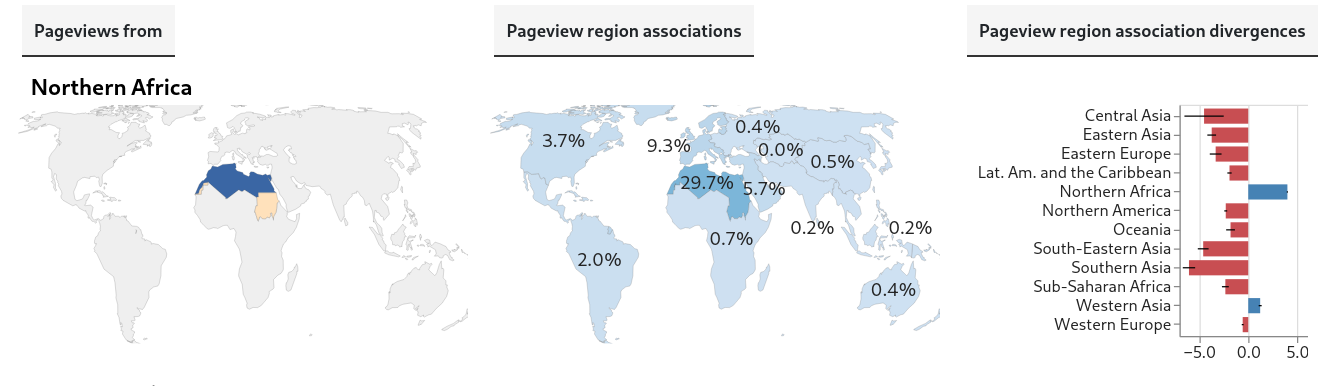
The first map shows the region the pageviews are from. Colors indicate the status of the data for pageviews from countries in that region: blue is for countries with valid data, pink, for countries that are omitted from the Differential Privacy dataset, and yellow, for countries with inadequate data for analysis (based on minimum thresholds for the number of pageviews and unique articles in a sample). Despite the missing and inadequate data, we have coverage of most of the population in most regions.
The second map shows, for pageviews from the region, the estimated proportions of pageviews associated with each global region (that is, more precisely, the estimated proportions of pageviews that are of articles about topics associated with each global region).
Importantly, the estimates for pageviews from every region are weighted averages, based on independent samples of pageviews from all the countries in the region. The weights used are the estimated internet-connected population in the country.
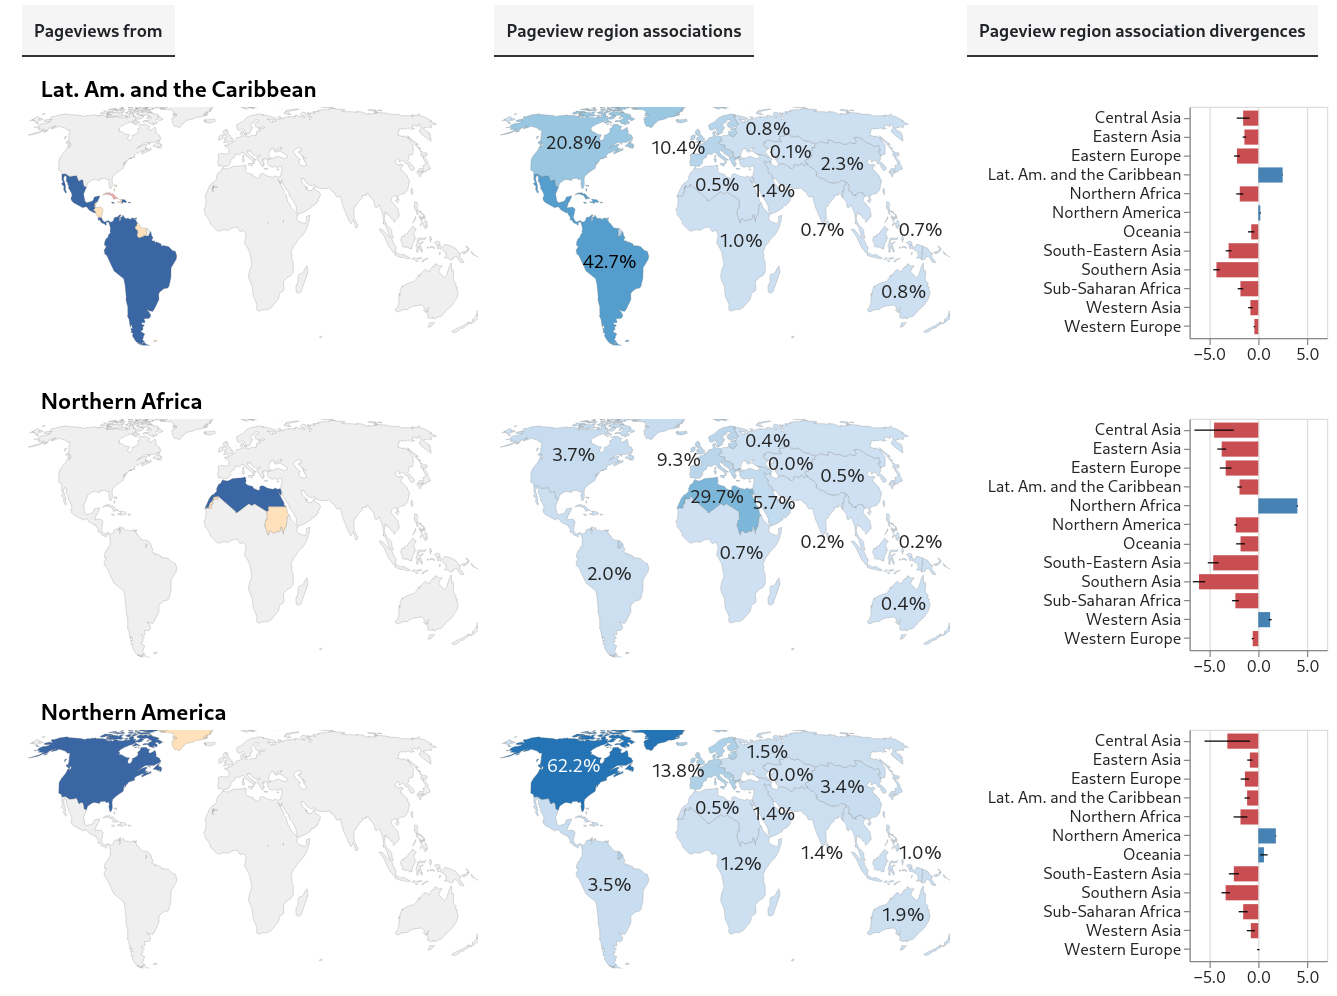
So, for example, for pageviews from Northern Africa, we estimate that 29.7% of all (internet-population-weighted) pageviews in October, 2025 were associated with Northern Africa and that 5.7% were associated with Western Asia:
As noted above, articles can be associated with a geographic location in a variety of ways, so these observations encompass more than just articles about geography or physical things with a fixed location.
Also, a pageview can be associated with more than one region. For example, a pageview of an article about the East India Company would be associated with both Western Europe and Southern Asia, since that company was used by Britain to rule India. For this reason, the percentages don’t add up to 100%; every percentage is an independent estimated proportion of pageview associations with a region.
By using countries’ internet-connected populations as weights for calculating contributions to aggregate regional and global estimates, we partly offset the bias from countries that have relatively more pageviews but smaller populations. So, for all aggregations above the country level, estimates are derived from stratified samples, and the global internet-connected population (or, specifically, the internet-connected population of all the countries for which we have valid samples) is the human population we can potentially make inferences about most directly.
Finally, the bar charts show each region’s divergences from global values. These divergences are a measure of difference; for pageviews from each region, we’re seeking to quantify how different the estimated region-association proportions are from the corresponding global estimated region-association proportions. We’ll call these global estimates the global baseline.
For example, again looking at pageviews from Northern Africa, we see the region has a divergence score of about 4 for Northern Africa (itself), accompanied by negative divergence scores for most other regions. This means that internet population-weighted pageviews from Northern Africa are much more likely to be of articles associated with Northern Africa than are pageviews in general from any region.
The type of divergence score we’re using is Log Risk Ratio (using log base 2). It’s straightforward to interpret: if the score is 0, the regional proportion and the global baseline are equal. If it’s positive, the regional proportion is greater than the baseline, and if it’s negative, the opposite is true. Linear increases in absolute value correspond to exponential changes in the ratio between regional and global baseline proportions. In the example above, Northern Africa’s divergence score of 4 for pageviews associated with itself means that (after weighting by internet-connected population) pageviews from that region are 16 times more likely to be associated with Northern Africa than are pageviews from the world overall.
Every region has itself as its highest divergence score. This is what I call a robust-looking result! (I haven’t calculated statistical significances yet, though. The pervasive negative scores for other regions also seem relevant and bear further digging.)
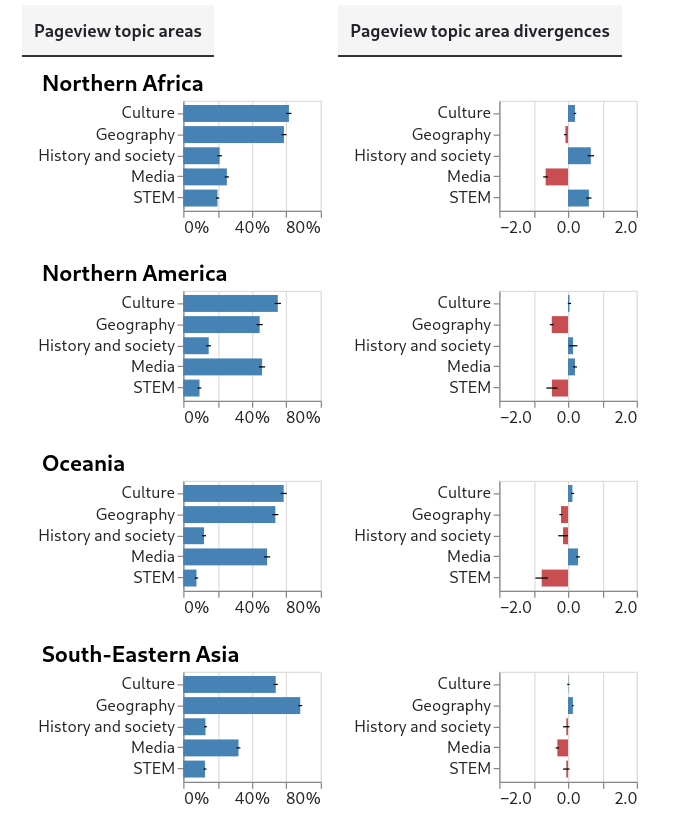
Pageview topic associations
The approach I used for analyzing topic area associations is similar to the one used for region associations. In line with previous research on temporal patterns in pageviews of article topic areas [10], I processed model output into five non-exclusive top-level topic categories: Culture, Geography, History and society, Media and STEM.
Here are plots for the same 12 regions, in 3 images:
Central Asia, Eastern Asia, Eastern Europe, Lat. Am. and the Caribbean
Northern Africa, Northern America, Oceania, South-Eastern Asia
Southern Asia, Sub-Saharan Africa, Western Asia, Western Europe
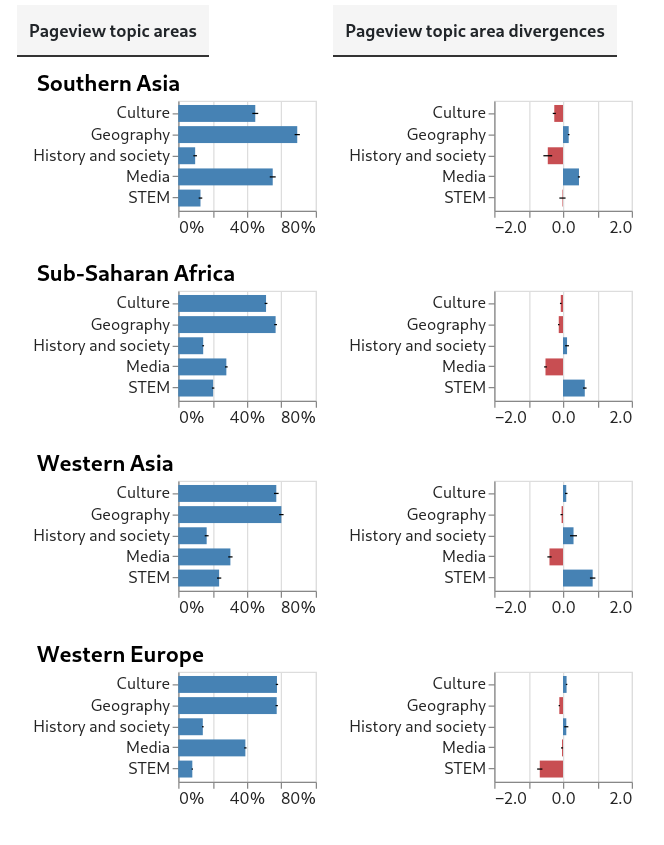
There are two plots for each region. The first shows the estimated proportions of topic area associations for pageviews from the region. The second plot shows the divergences between the region’s estimated proportions and the estimated proportions of the global baseline. As with region associations, topic-area associations for both region and global estimates are weighted averages, and are calculated from the same per-country samples as were used for region associations.
Note that in the second plots, the scale of the axis showing divergence scores is narrower than the scale used in the plots for region association divergences. Unlike in the case of region associations, the absolute values of divergence scores for topic area associations almost never exceed 1.
It’s relevant that the patterns we see for region associations and topic area associations are at once distinct and internally consistent across pageviews from global regions. Taken together, these two results lend credence to the idea that the data and the methodology used do indeed shed light on patterns in background social phenomena (though this is still not certain).
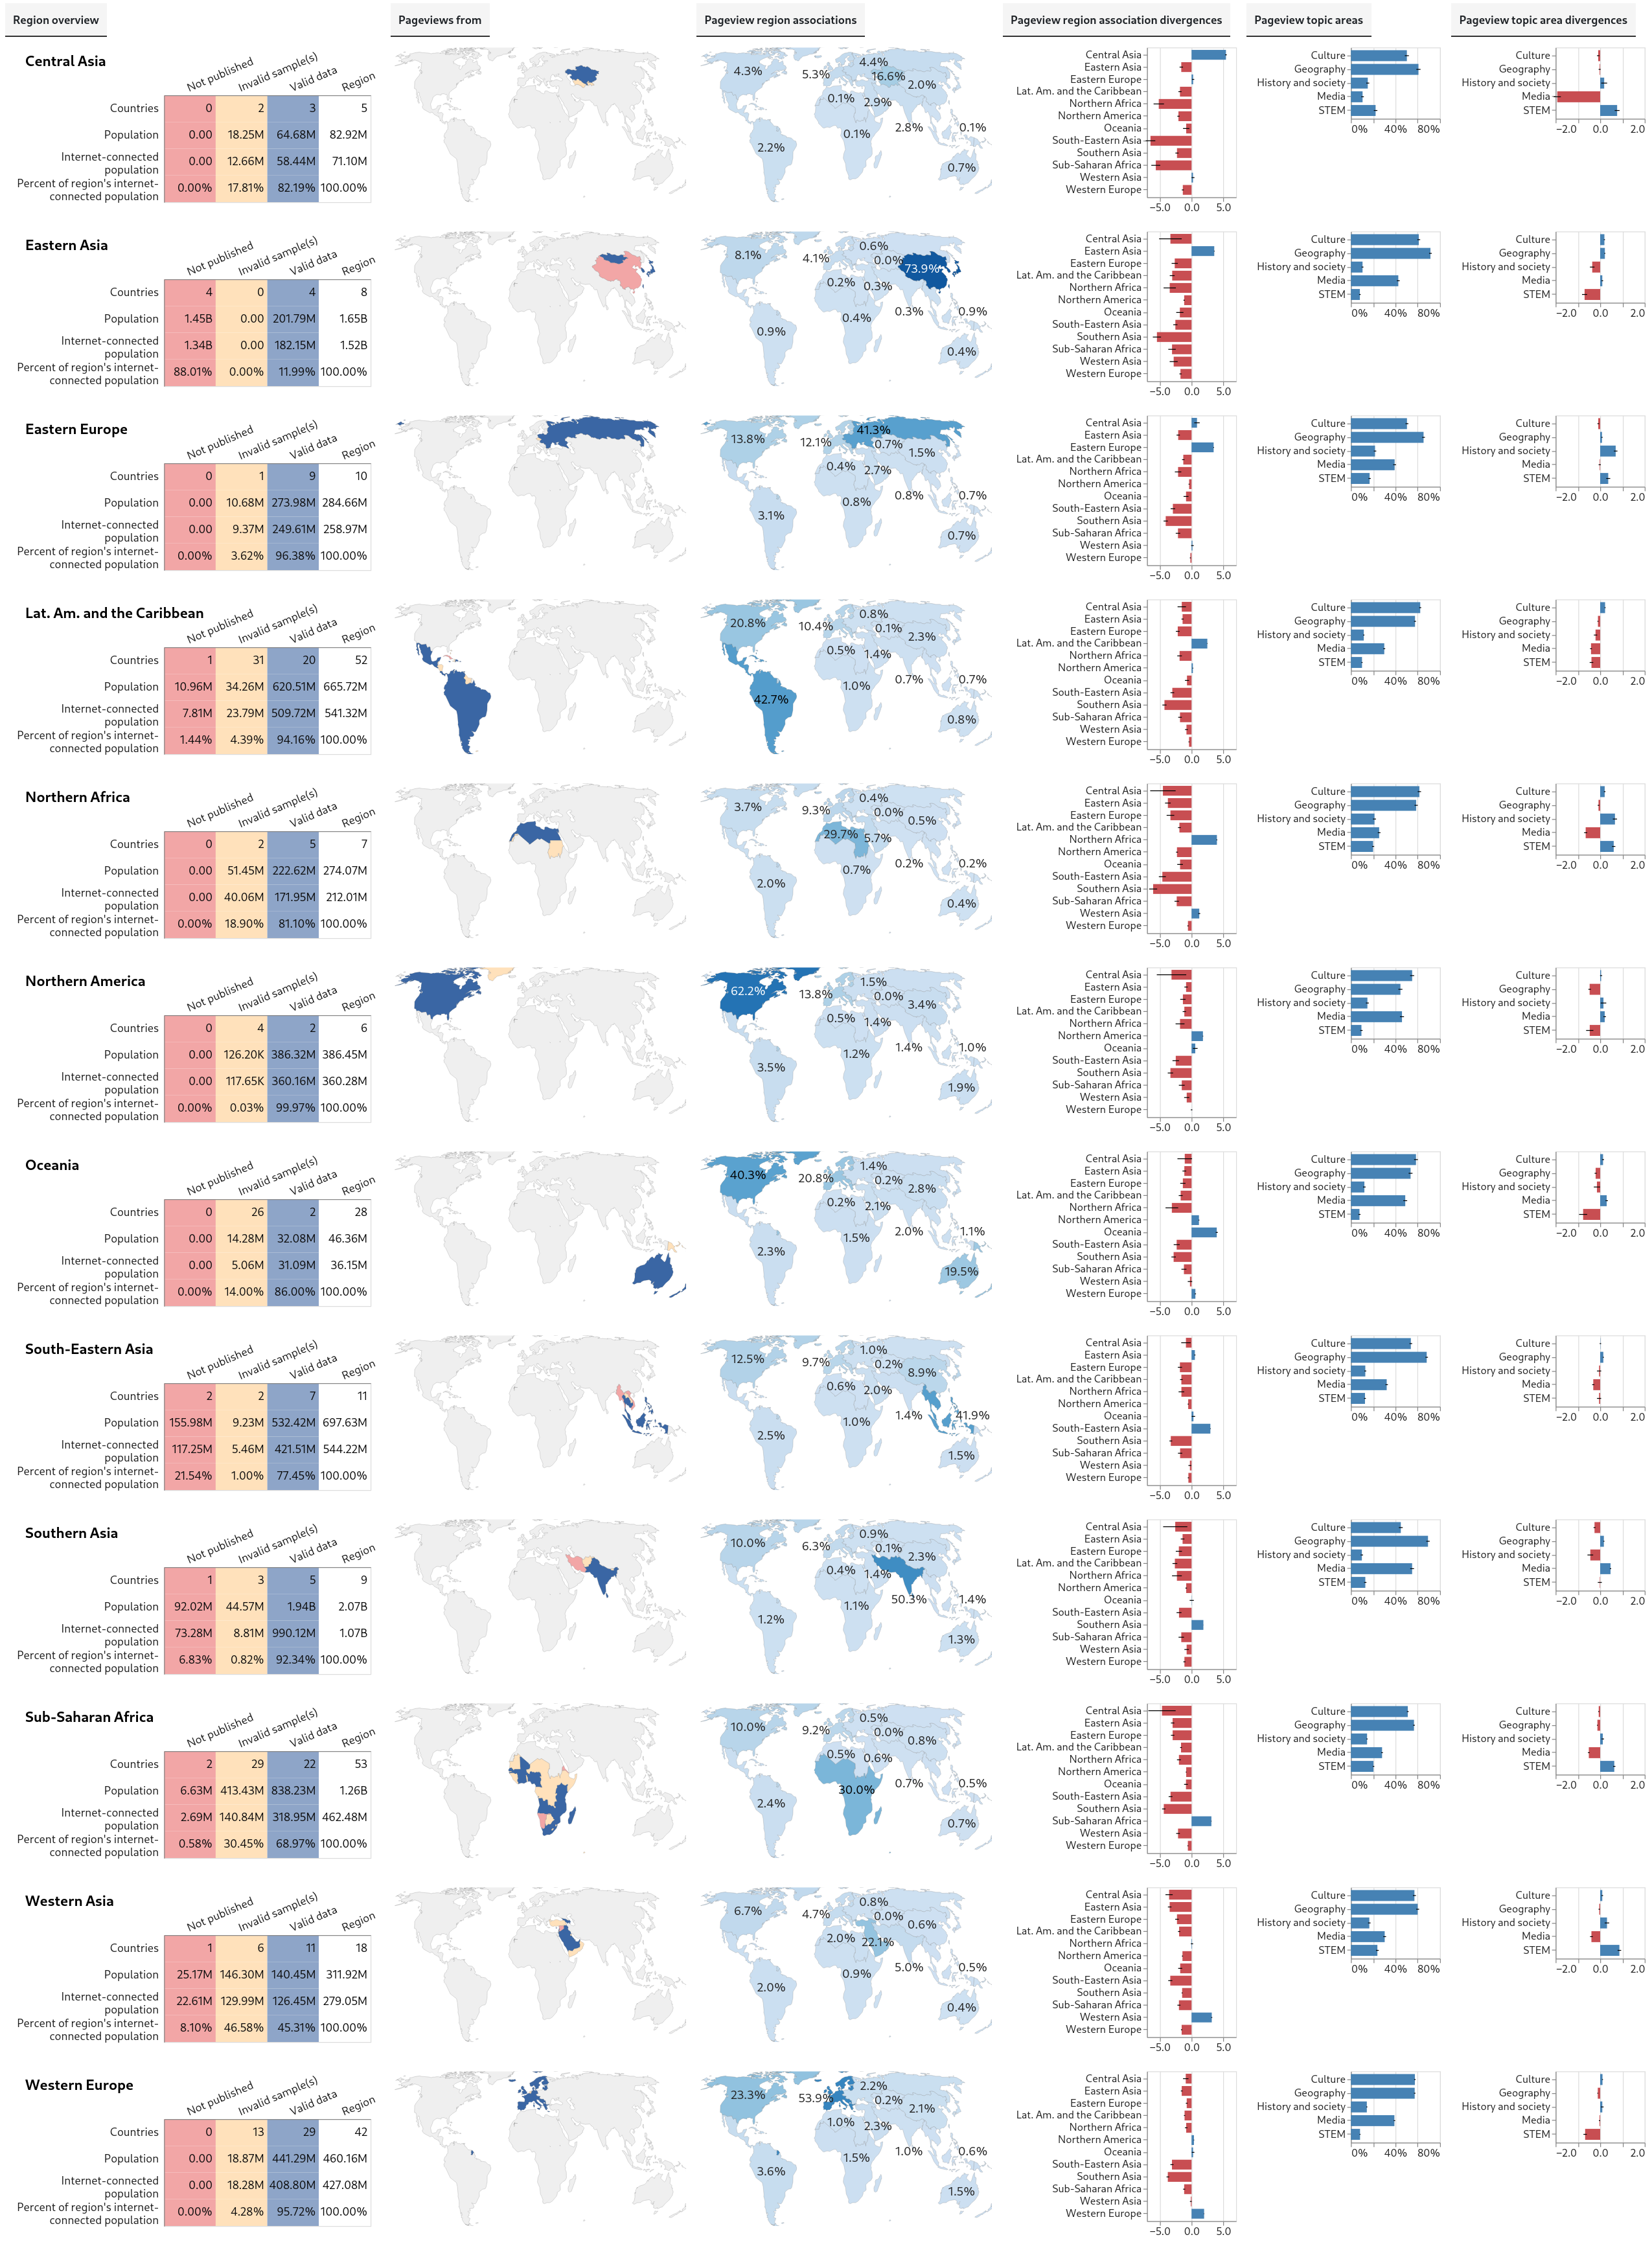
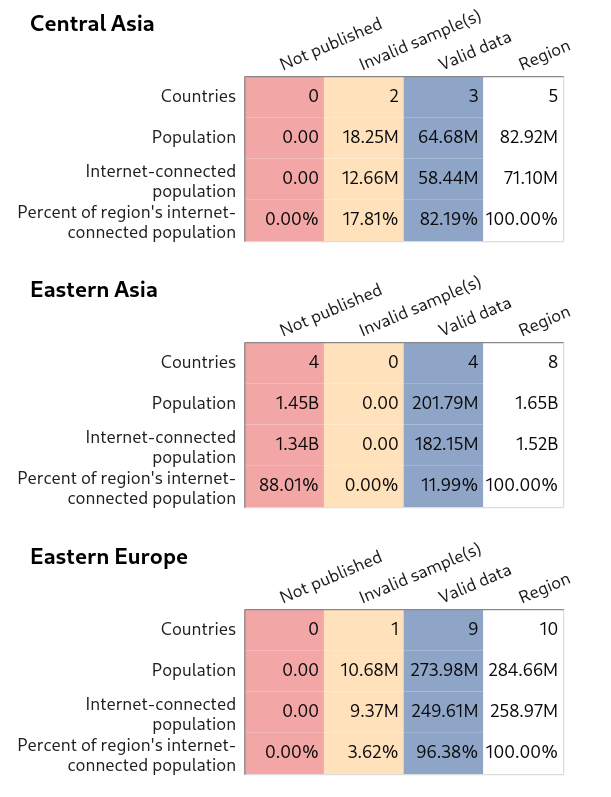
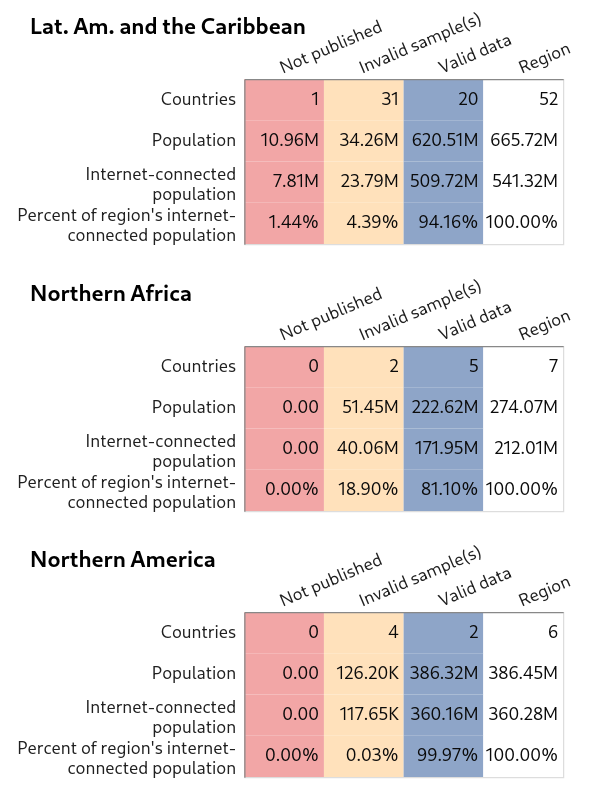
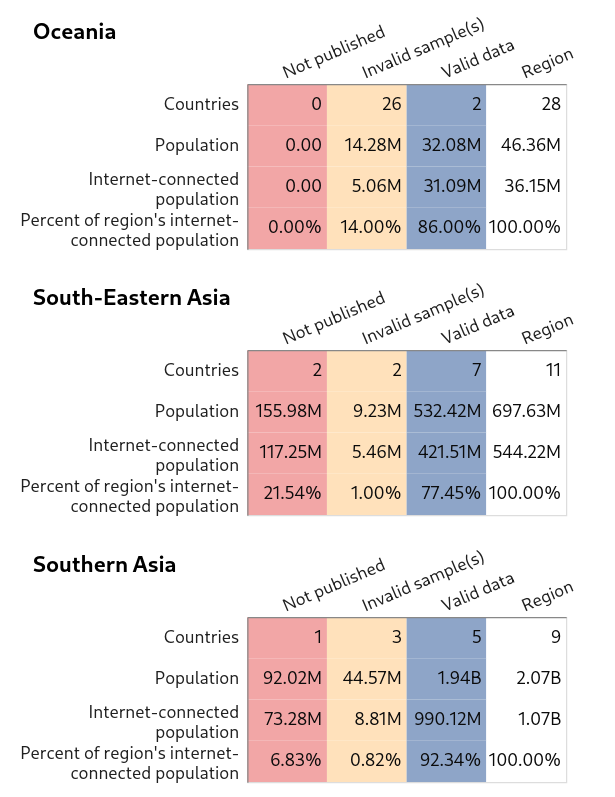
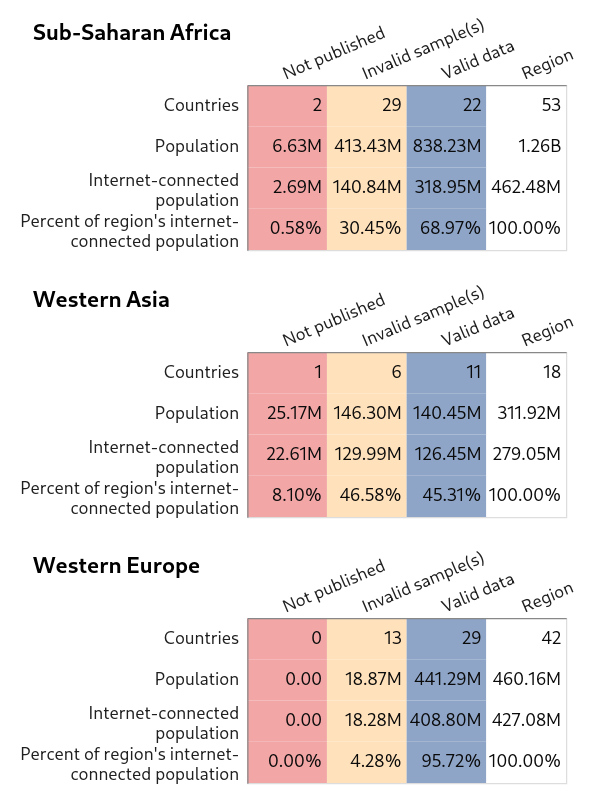
Data coverage
The last plots I’ll share provide an overview of data coverage for each region in terms of demographics, including aggregate internet-connected population estimates, which is the measure used for weights. The plots are mostly self-explanatory. The first three columns refer to the same sample statuses mentioned above (valid data, data omitted from the Differential Privacy dataset, and inadequate samples). The last column shows totals for the region.
Central Asia, Eastern Asia, Eastern Europe
Lat. Am. and the Caribbean, Northern Africa, Northern America
Oceania, South-Eastern Asia, Southern Asia
Sub-Saharan Africa, Western Asia, Western Europe
Most invalid samples are from countries with relatively small internet-connected populations. Also, it might be possible to obtain usable data for many of these locations via a more sophisticated sampling approach.
It seems likely that most of the data issues are due to engineered degradations in the Differential Privacy dataset intended to protect user privacy. (Data points deleted from the dataset constitute data missing not at random. Indeed, these removals impact, at least to some degree, results for all locations. Since the differential privacy processing removes articles that don’t receive a minimum number of global pageviews, it’s likely that the bias created is in the direction of countries with more pageviews.)
Sampling and data processing
The code for the full data pipeline used in this project is available here [11].
The rows of the Differential Privacy (DP) pageview tables are articles, not pageviews. However, the pageview is our main unit of analysis. To sample pageviews, the sampling code calculates the total pageviews in the dataset for each country over the given timespan, generates n random numbers between 0 and N-1, and then retrieves information about each sampled pageview for the country from the DP files as if the files contained rows of country-specific pageviews indexed from 0 to N-1. For row selection, the code takes the random numbers to be indices.
For the topic and geographic associations of the articles viewed, I made the perhaps unorthodox decision to query models about English-language versions of articles whenever possible. I believe this is justified (more on this another day) and should lead to more consistent results than would be obtained if the models were queried in the languages of the pageviews. I used the Wikidata QIDs and the Wikidata API to find equivalent page titles in English Wikipedia.
(QIDs are identifiers that link Wikipedia articles to Wikidata, a vast repository of structured data. QIDs identify items in this repository, which, in turn, have links to the titles of related Wikipedia pages in all language editions.)
For articles with no QID, I queried the machine learning models about the article in the language it was originally viewed in.
The Wikipedia API was also consulted to determine if articles were disambiguation pages or if they had been deleted since being viewed.
The model used to find articles’ geographic associations outputs predictions for country associations. These were processed into binary region associations based on the region that each country was considered to be a part of in the selected global region scheme.
All of the above data was stored in a relational database for ease of processing.
Population and internet-connected population data was downloaded from the United Nations and the World Bank [12][13].
To calculate margins of error for divergence scores, the Delta method was used, taking into account covariance resulting from the fact that regions are included in the baseline they are compared to.
Results shown are based on pageviews for all of October, 2025. I attempted to sample 2500 pageviews per country over that timespan, however, for some countries, this exceeded the number of pageviews in the dataset. Cutoffs for sample validity were: a minimum of 200 effective sample size (defined as the number of pageviews in the sample that are of articles with valid model output) and a minimum of 40 unique articles in the effective sample.
Approach
To reasonably process and analyze this data, I had to make several decisions about methodology. I have a lot to say on this topic. Here are just a few salient points.
I’ve mostly followed causal and social systems perspectives (mentioned in RQ2). Together, these approaches provide a framework for connecting specific knowledge and assumptions about how people act and think (for example, related to the act of viewing a Wikipedia article) with more general knowledge about societies (such as cultural differences, regional identities or demographics).
On the systems view, in large, complex systems, one can typically identify subsystems, and often, multiple, overlapping subsystems. Global humanity can thus be understood as a single, immensely complex social system, having subsystems of multiple types and at multiple levels, with varying degrees of overlap and interactions among them.
This is relevant for studying Wikipedia pageviews because when people read Wikipedia, they do so in conjunction with other activities related to their social contexts. To study these activities and contexts is to study the social systems and subsystems they are a part of. That is, in essence, to study global Wikipedia readership is to study the global social subsystems in which reading Wikipedia takes place.
If we find patterns (differences, similarities, trends) in how people consult Wikipedia across global regions, then a fundamental, general hypothesis is that these patterns may reflect, at least in part, patterns in the dynamics of social subsystems across these regions. This general hypothesis constitutes a basic point of departure for any more specific hypotheses that may be proposed pursuant to RQ2.
Following the systems view, it’s clear that the choice to use a modified United Nations Level 2 region scheme can be at best tentative. Though roughly related to history, culture, demographics and geography, that scheme is not an evidence-based clustering of world regions, which is what would be needed to discover actual social subsystem dynamics. It is also not an evidence-based representation of regional identities across the globe (and such identities could, hypothetically, be a cause of regional self-focus in people’s selection of Wikipedia articles to read).
The causal approach is useful here since it can help clarify, and potentially formalize, assumptions about how broad social phenomena that are of interest may or may not be reflected in the actual data we have.
More concretely: we hope that pageviews data may shed light on social phenomena. To determine whether it can, we should try to understand the chain of causal interactions between the phenomena of interest and the data. For example, we could hypothesize that regional identities lead to people choosing to read more about topics related to their own region, but there is another important cause of the selection of articles that people end up reading: the algorithms of the search engines that readers typically use to reach those articles.
In causal terms (following Judea Pearl’s theory of causality [14]) these two hypothesized causes of article selection (regional identity and search engine algorithms) are colliders: causes that together contribute to an observed effect. Furthermore, we can identify numerous mediators (intervening cause-and-effect relationships that separate a cause and an effect of interest) in the causal chain between peoples’ actions of viewing a Wikipedia article and the Differential Privacy pageview dataset.
Further work
There’s much more work to be done on all this! Next steps include clustering, calculating content availability baselines, improving sampling for countries with less pageviews, studying patterns at country-level granularity and by language, and completing the conceptual framework. Please stay tuned!
References
[1] WMF Research Team. (2025) Readers and Readership research: Key learnings from a decade of research and what’s ahead. Presentation at the Wikimedia Research Showcase. https://figshare.com/articles/presentation/Wikipedia_Readers_and_Readership_Research_Key_findings_from_a_decade_of_research_and_what_s_ahead_-_Wikimedia_Research_Showcase_-_September_2025/30230695?file=58345342. https://youtube.com/live/vqIp3CSgAVA.
[2] Wikimedia Foundation. Pageviews Differential Privacy — Current. https://analytics.wikimedia.org/published/datasets/country_project_page/00_README.html.
[3] Help:Items. Wikidata. https://www.wikidata.org/wiki/Help:Items.
[4] Machine learning models/Production/Language agnostic link-based article topic. Meta-Wiki. https://meta.wikimedia.org/w/index.php?title=Machine_learning_models/Production/Language_agnostic_link-based_article_topic&oldid=29340984.
[5] Machine learning models/Production/Article country. Meta-Wiki. https://meta.wikimedia.org/w/index.php?title=Machine_learning_models/Production/Article_country&oldid=29338129.
[6] Dittus, M. (2018) The Uneven Geographies of Wikipedia. Oxford Internet Institute. https://geography.oii.ox.ac.uk/the-uneven-geography-of-wikipedia/.
[7] Movement Strategy/Initiatives/Bridging Content Gaps. Meta-Wiki. https://meta.wikimedia.org/wiki/Movement_Strategy/Initiatives/Bridging_Content_Gaps.
[8] Lemmerich, F. et al. (2019) Why the World Reads Wikipedia: Beyond English Speakers. WSDM '19: Proceedings of the Twelfth ACM International Conference on Web Search and Data Mining. https://doi.org/10.1145/3289600.3291021.
[9] Our World in Data. (2026) Data Page: World regions according to the United Nations (Level 2). Data adapted from United Nations Statistics Division. https://archive.ourworldindata.org/20251112-093009/grapher/world-regions-un2.html.
[10] Piccardi, T. et al. (2024) Curious Rhythms: Temporal Regularities of Wikipedia Consumption. Proceedings of the Eighteenth International AAAI Conference on Web and Social Media. Association for the Advancement of Artificial Intelligence. https://ojs.aaai.org/index.php/ICWSM/article/view/31386/33546.
[11] Wiki Readership. https://gitlab.wikimedia.org/andyrussg/wiki_readership.
[12] World Bank Group. Individuals using the Internet (% of population). https://data.worldbank.org/indicator/IT.NET.USER.ZS.
[13] United Nations. World Population Prospects 2024. https://population.un.org/wpp/downloads?folder=Standard%20Projections&group=CSV%20format.
[14] Pearl, J. Causality: Models, Reasoning and Inference, second edition. Cambridge, Cambridge University Press.